
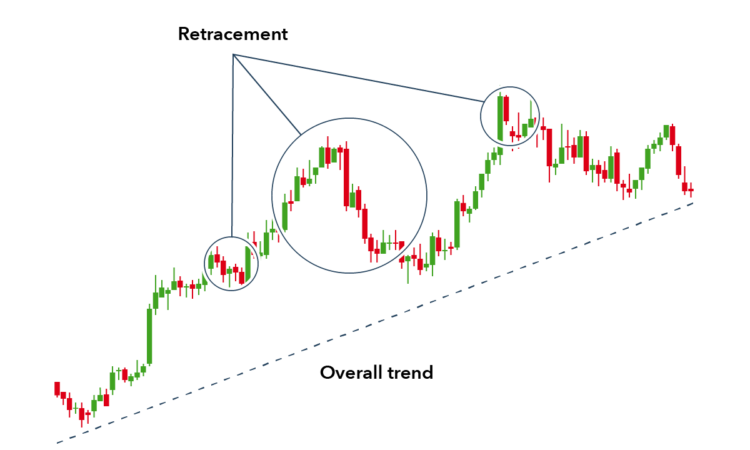
Price action is the study of market price fluctuations. Many fundamental and technical analysis techniques get their worth from price, so why not examine, evaluate, and learn from the price itself? Price action traders attempt to do precisely that. They believe that the price tells them all they need to know about a certain market. This is what distinguishes price action from other trading strategies that depend largely on quantitative indicators. The two most important factors to consider when trading price movement are the price and time variables that are readily shown on a ‘clean’ chart. It is referred to as a clean or naked chart since there are no indicators to distort the price viewpoint.
If your price action analysis indicates that the price is about to climb, you may want to go long; if you feel the price will fall, you may want to go short. Understanding price action trading entails analysing patterns and recognising significant signs that may affect your investments. Many traders utilise a variety of price action tactics to forecast market moves and achieve short-term gains.
Price action trading strategy also comprise psychological and behavioural judgements and behaviours based on the price action trading course:
- Support and Resistance: A price level at which demand is judged to be strong enough to prevent the price from falling further is referred to as a support level. A “floor” is formed when the price rebounds back up off the support. The price level at which selling is deemed strong enough to prevent the price from increasing any further is referred to as resistance. A “ceiling” occurs when the price swings back down from resistance. Support and resistance levels can assist traders choose when to enter and leave transactions.
- Trendlines are simple tools that link a stock’s high points to show the security’s current direction. Many traders use trendlines to determine if a stock is in an uptrend or downtrend while looking for channel breakouts and price goals. If they feel a channel will hold, they should buy at the bottom and sell near the top.
- A typical method for determining potential price goals for volatile assets is to use Fibonacci retracement levels. These are horizontal lines that run along the peaks and troughs of a stock chart and have been segmented to provide whole number ratios. Different retracement levels are used for different time periods, but for swing traders, 38.2 percent, 50 percent, and 61.8 percent are frequent. These levels are predicated on the notion that financial markets regularly retrace specific percentages after major swings, implying that they might serve as perfect entry or exit points.
- When a significant advance to a new high or low happens because the previous trading range is no longer feasible, resistance is formed (overwhelming selling pressure). After the former trading range is breached, it becomes support. The finest deals are struck during this transition phase, when supply and demand are temporarily balanced.
- The opening and closing bells are significant because they signal when traders have completed collecting or distributing shares. If commerce was active throughout the day but silent at night, it indicates that supply will be curtailed in the future. However, if commerce is poor at the start and strong at the conclusion, it signals that demand will be strong after hours.
- Volume is simply the total number of shares traded in a given time period. Prices are tied to volume, so when there is a lot of stuff, prices rise, and when there isn’t, prices fall.
- This COT report calculates the net position of commercial participants (those who buy and sell for their own accounts) as well as smaller “non-reportable” dealers such as large corporations, governments, and investment managers. A high level of business activity might suggest that a trend change is on the way.
- Market sentiment polls and technical analysis sentiment studies are examples of this. Some traders, for example, use sentiment analysis to determine if a stock is overbought or oversold.
- Head and shoulders patterns, for example, are typically seen in association with divergence. Divergence happens when an indicator makes a lower high while prices make higher highs (or vice versa), indicating that there is less purchase pressure than usual.
- Chart formations such as head and shoulders, triangles, wedges, and others are accessible. Ahead and shoulders pattern, for example, implies a minor down followed by a larger rally – think W shaped. This might signal a trend reversal, with the price dropping back to test support.
Even if the price has plummeted, if more people are bullish on a stock than bearish, it is often not a good time to sell. If, on the other hand, there are more bearish than bullish people, it may be a good moment to buy. These were some helpful price action patterns and strategies. Finlearn Academy is the finest initiative for individuals who wish to learn more about the stock market.


